July natural gas futures were tumbling into expiration, and the near-term outlook for the August contract also looked bleak as weak LNG demand and rising production placed bears in the driver’s seat.

Here’s the latest:
- July futures were off 13.9 cents to $2.617/MMBtu at around 2:00 p.m. ET. August futures were down 10.7 cents to $2.756
- Feed gas flows to U.S. liquefied natural gas facilities were holding below 13.0 Bcf/d
NGI’s U.S. LNG Export Flow Tracker showed Freeport LNG operating at 75% of its capacity on Wednesday after an apparent glitch cut nominations to the facility late Tuesday. On Wednesday, total flows to domestic LNG facilities, at 11.92 million Dth, were above the 11.23 million Dth reported a day earlier.
Diminished LNG demand limited the impact of weather outlooks that remained supportive at midday.
Data from the Global Forecast System trended about 2 cooling degree days (CDD) hotter, while the European model was 1 CDD cooler.
NatGasWeather said both models forecasted one of the hottest late June to July weather patterns of the past 50 years. The firm said both overforecast heat last summer, and the expectation was that they would do so again this summer.
Meanwhile, Wood Mackenzie data showed that this week residential/commercial sector demand, driven mostly by air conditioning, and natural gas demand for power generation averaged 10.5 Bcf/d and 45.8 Bcf/d, respectively.
The combined demand-side fundamentals are likely to have contributed to an expected comparatively small injection into natural gas inventories for the week ended June 21.
NGI modeled a 54 Bcf injection into stocks, which would compare with the five-year average build of 85 Bcf and the year-ago increase of 81 Bcf.
The latest estimates from Reuters ranged from injections of 32 Bcf to 58 Bcf, with a median increase of 50 Bcf. A Bloomberg survey ranged from builds of 49 Bcf to 63 Bcf, with a median at a 54 Bcf injection.
The total working gas supply was 3,045 Bcf after the EIA reported a 71 Bcf build for the week ended June 14. Stocks were 343 Bcf higher than the same time last year and 561 Bcf above the five-year average.
Early estimates submitted to Reuters for the week ending June 28, ranged from additions of 13 Bcf to 76 Bcf, with an average increase of 41 Bcf. That would compare against a build of 76 Bcf during the same week last year and a five-year average increase of 69 Bcf.
- Cash prices mostly lower on moderate cooldown
- West TX/SE NM Regional Avg. up 51.0 cents to negative 2.5 cents
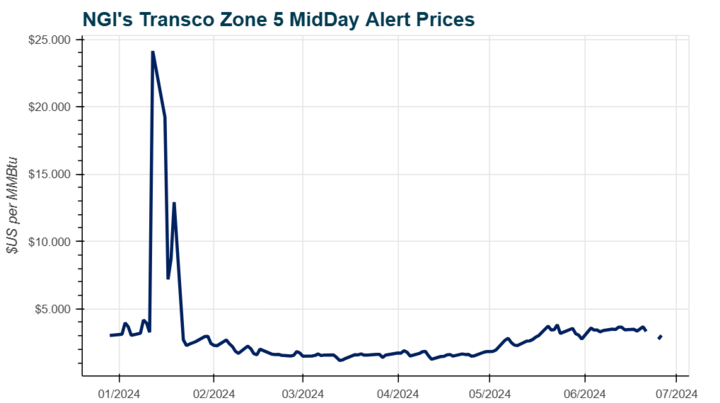
- Transco Zone 5 in the Southeast region down 17.0 cents to $3.030
Transcontinental Gas Pipe Line Co. LLC was starting to flow more freely with some of the maintenance restrictions ended, pressuring Southeast prices.
Independent meteorologist Corey Lefkof said that near-record cooling degree days are forecast late in the six- to 10-day period and into the 11- to 15-day outlook because of strong demand in regions served by the Electric Reliability Council of Texas and the Southeast Reliability Corporation.


