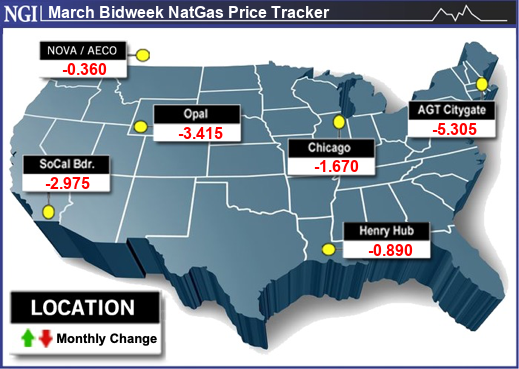
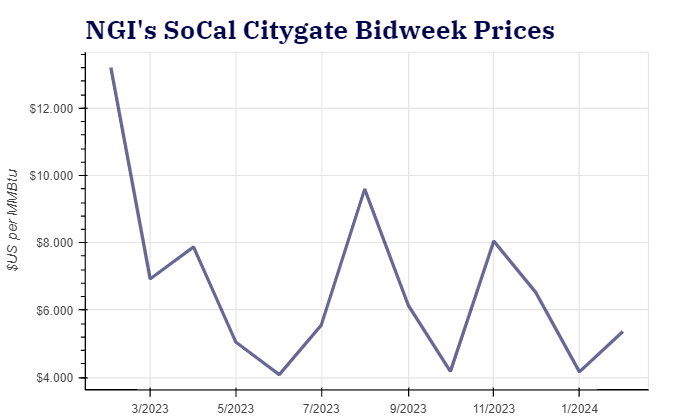
Natural gas prices retreated in March bidweek trading as signs of declining production were eclipsed by paltry weather-driven demand and lofty levels of supply in storage.

NGI’s March Bidweek National Avg. fell $1.710 month/month to $1.505/MMBtu. That was down from $2.870 a year earlier.
Trading for the latest bidweek period spanned Feb. 23, 26 and 27. Weather conditions proved mostly mild over that stretch, and National Weather Service (NWS) forecasts called for more of the same through the first half of March.
Some hubs got a bump in bidweek trading from expectations – and later the realization – of a brief but substantial burst of Arctic air over the final two days of February. That cold front engulfed swaths of the central and eastern United States.
Additionally, production slowed to a pace below 103 Bcf/d in late February, following vows from Chesapeake Energy Corp. and others to pull back on output this year. Production still proved robust last month by historical standards – about 3 Bcf/d above year-earlier levels – but it dipped notably from the 107 Bcf/d record highs reached early this year, according to Wood Mackenzie estimates.
Still, as Paragon Global Markets LLC’s Steve Blair said, the anticipated anemic heating demand for the final throes of winter empowered bears.
“Unless we get some change in the forecast for colder weather, I don’t see any great prospects for prices to shoot to the upside at any point in the near term,” Blair, managing director of institutional energy sales, told NGI.
Steep losses peppered the Northeast and the western United States during bidweek.
Algonquin Citygate near Boston plummeted $5.305 to average $1.965, while Transco Zone 6 NY lost $2.430 to $1.440.
Out West, Malin slumped $3.045 to $1.785, while Opal in the Rockies dropped $3.415 to $1.805.
Lower prices also spanned much of the Midwest, Midcontinent and the South, including Texas.
El Paso Natural Gas (EPNG) in late February posted an update to a force majeure on its Line 2000 that it initially announced earlier in the month. It said repair work impacting western operational capacity and flows from the Permian Basin to Arizona and beyond could be limited through March.
When EPNG and Permian Highway Pipeline curtailed flows to the West in recent years, the actions tended to result in backed-up supplies in West Texas and depressed prices at the benchmark Waha and other hubs in the region. This time around proved no exception, with prices down across the region and Waha off $1.640 to 59.5 cents.
Futures Rollercoaster
On the final day of the latest bidweek period, the March Nymex natural gas futures contract rolled off the board with a 4.4-cent loss. It settled at $1.615 on that Tuesday, essentially flat with the close of the prior two weeks but down from a year earlier. The March contract in 2023 expired at $2.451.
The April contract took over Wednesday and notched a 7.7-cent gain to $1.885, capping a three-day rally. It proceeded to give up ground on Thursday and Friday, however, and closed the week at $1.835 after another meager government inventory report that extended a weeks-long trend.
“Successive weeks of smaller-than-average withdrawals since mid-January have expanded the surplus to the five-year average continuously,” Gelber & Associates analysts said.
The U.S. Energy Information Administration (EIA) on Thursday posted a withdrawal of 96 Bcf natural gas from storage for the week ended Feb. 23. It came in far below the five-year average decrease of 143 Bcf.
The latest result put inventories at 2,374 Bcf and swelled the surplus to the five-year average from 22% to 26.5%. That more than doubled the surplus from the start of the year.
The EIA print was “not enough to help clean up balances which are bloated as a result of losing nearly 800 Bcf of demand from warm winter weather,” said analysts at Mobius Risk Group. “In the weeks ahead, we will need to see definitive weather adjusted tightness for the market to begin recovering.”
Given the NWS forecasts for the first two weeks of March, though, the odds are stacked against bulls on the demand side of the equation for now.
Injections Ahead?
Wood Mackenzie analyst Eric McGuire expects a net storage increase of 7 Bcf for the week ending March 8. “This would be the earliest injection we have seen since Feb. 24, 2017,” he said. “In seven of the last 10 years, the first injection of the year has come in either the last week of March or the first week of April.”
Looking ahead to the next EIA report, preliminary draw estimates submitted to Reuters for the week ended March 1 averaged 34 Bcf. That compares with a pull of 72 Bcf a year earlier and a five-year average decrease of 93 Bcf.
Production, of course, remains the big wildcard on the supply side.
RBN Energy LLC analyst John Abeln said that, while producers may in the near term sustain a pullback from record levels, they are likely to ramp back up by next year and continue to post output gains through the decade and beyond to meet an expected surge in LNG demand in the back half of this decade. Multiple new liquefied natural gas export facilities are in the works along the Gulf Coast to meet growing global energy needs.
“We anticipate significant natural gas production growth over the next decade, with the Lower 48 producing roughly 19% more in 2035 than in 2023 as production leaps by 18.9 Bcf/d to an average of 121 Bcf/d, from less than 103 Bcf/d last year” on average, he said Thursday.
“The growth trajectory is strongest over the next six or seven years, slowing to less than 1% year-on-year after 2030,” Abeln added. “We estimate that over half of the growth in U.S. production will come from the Permian Basin. Permian output is expected to rise by 40% to more than 26 Bcf/d by 2035.”


